
Category Archives: Business Intelligence Dashboards
-

Business Intelligence Hottest Trends
There has been a hot topic on LinkedIn about what the hottest trend is for Business Intelligence (BI). Some of the responses have been around dashboards, mobility, integration. From my point of view the hottest and important items not trends for BI to actually work are so you can make objective decisions are: Ability to […]
Continue Reading... -

WAIT! Read This Before You Pick The Wrong BI Solution
There is so much buzz going on around big data, dashboards, metrics, etc.. Companies are implementing BI solutions in-house or in the cloud. Some companies are selecting BI solutions just because of the brand name. Other companies are selecting BI solutions because they think they are getting something that will answer a specific question today. […]
Continue Reading... -

STOP Wasting Money Due To Lack Of Analytics
I read an article the other day written by Joe Curtis called “Firms ‘wasting money on data centres of lack of analytics’” Mr. Curtis was correct that firms are wasting money due to the lack of analytics but not just on data centers. Firms are wasting money on resources, software, hardware, and much more due […]
Continue Reading... -
Don’t Cram and Jam
There is so much data available and so many pretty charts that you can make but do you really need to see all of them? Do you really need to see all of them on the first page? Don’t cram and jam all of the charts on the same page. Below are some items to […]
Continue Reading... -

The Top 3 Reasons To Implement A BI Dashboard
Dashboards are evolving more and more everyday to provide organizations with a clearer view, which allows users to make fact based decisions. Below are the key reasons to implement a BI dashboard no matter how big or small your organization is: Collaboration. Dashboards allow everyone to view the same information at the same time allowing […]
Continue Reading... -
The Top 5 KPIs For Your Business
There are so many different types of Key Performance Indicators (KPIs) available in so many different formats. You could go out and build them all but what value would that actually give you? Let’s first look at what a KPI is: According to Wikipedia, KPIs are financial and non-financial metrics used to help an organization […]
Continue Reading... -
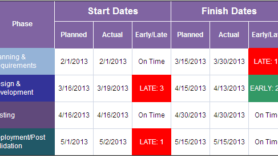
Don’t Be The Last To Know
Did you know that your project missed a critical milestone three weeks ago? Did you know that the project went over the budget four weeks ago? Someone in your organization knew that the milestone was missed. Someone also knew that the project went over budget. Did you know before these issues happened? My recommendation is […]
Continue Reading... -

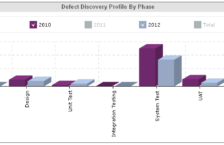
The Devil Is In The Details
Ever notice how dashboards never tell the whole story? Don’t you want to know what’s causing that spike in the chart? Example: Testing dashboard shows the number of test cases by status (passed/failed/not executed/etc.). They may even show the number of test cases by status per module/functionality for the application under test (AUT). That’s all […]
Continue Reading... -

Don’t Go Overboard. Keep It Simple Stupid!
Just because you can make pretty charts and pictures for metrics doesn’t mean you need to go haywire. When you are putting metrics together always keep K.I.S.S. (Keep It Simple Stupid) in mind. When putting any metric together ask yourself these questions: What do you want to show/prove? You can make charts for basically anything […]
Continue Reading... -
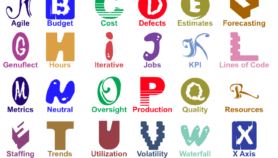
Do You Know Your ABC’s of Software Metrics?
Which letters do your metrics include?
Continue Reading...

Connect With Us
Featured In

Recent Posts
- State of Testing Survey 2016 – Announced
- Big Data Quote – Hal Varian
- Creating Key Performance Indicators
- State of Testing Survey 2015 – Open
- State of Testing Survey 2015 – Announced
