
Category Archives: BigData Dashboards
-
Tool Reports Are Worthless
You probably have multiple tools that are used within your organization. All those tools probably have a report of some kind but those reports are worthless when you can’t see what’s causing items to occur. Management teams don’t look at metrics/reports just to see what’s going on, they also look at reports to make positive […]
Continue Reading... -

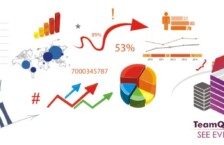
ABC’s of Chart Types
In a previous post we discussed the ABC’s of Software Metrics, which listed the various metrics that you can use throughout your project. Today we’re going to take it a step further and discuss charts & graphs. Charts & graphs are effective tools to convey information in a simple and visual way. They are also […]
Continue Reading... -
Stop Waiting For Metrics
In the past teams had to wait for reports to find out what was going on within their organizations. Are projects on time? Are projects within budget? Organizations use a variety of different tools (defect trackers, test trackers, code trackers, etc.) that are used by various teams to gather information and status on applications/projects . […]
Continue Reading... -
How To Choose The Best Chart For Your Data
There are lots of whitepapers, presentations & blogs out on the Internet that tell you to use one chart type versus another. It’s great that there are so many chart types available but do you know when to use a bar chart versus a line chart? This presentation will provide you information so the next […]
Continue Reading... -
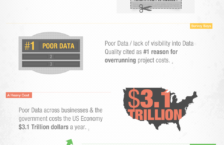
7 Facts About Data Quality [Infographic]
Continue Reading... -
6 Key Steps In Creating Metrics That Matter
There are lots of whitepapers, presentations & blogs out on the Internet that tell you to create one metric over another metric. It’s great to know about the variety of different metrics available but do you really need all of them? This presentation reduces the complexity to 6 key steps in creating actionable metrics that […]
Continue Reading... -

Business Intelligence Hottest Trends
There has been a hot topic on LinkedIn about what the hottest trend is for Business Intelligence (BI). Some of the responses have been around dashboards, mobility, integration. From my point of view the hottest and important items not trends for BI to actually work are so you can make objective decisions are: Ability to […]
Continue Reading... -

STOP Wasting Money Due To Lack Of Analytics
I read an article the other day written by Joe Curtis called “Firms ‘wasting money on data centres of lack of analytics’” Mr. Curtis was correct that firms are wasting money due to the lack of analytics but not just on data centers. Firms are wasting money on resources, software, hardware, and much more due […]
Continue Reading... -
Don’t Cram and Jam
There is so much data available and so many pretty charts that you can make but do you really need to see all of them? Do you really need to see all of them on the first page? Don’t cram and jam all of the charts on the same page. Below are some items to […]
Continue Reading... -

The Top 3 Reasons To Implement A BI Dashboard
Dashboards are evolving more and more everyday to provide organizations with a clearer view, which allows users to make fact based decisions. Below are the key reasons to implement a BI dashboard no matter how big or small your organization is: Collaboration. Dashboards allow everyone to view the same information at the same time allowing […]
Continue Reading...

Connect With Us
Featured In

Recent Posts
- State of Testing Survey 2016 – Announced
- Big Data Quote – Hal Varian
- Creating Key Performance Indicators
- State of Testing Survey 2015 – Open
- State of Testing Survey 2015 – Announced
