-
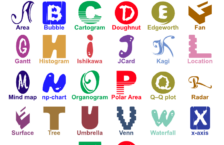
ABC’s of Chart Types
In a previous post we discussed the ABC’s of Software Metrics, which listed the various metrics that you can use throughout your project. Today we’re going to take it a step further and discuss charts & graphs. Charts & graphs are effective tools to convey information in a simple and visual way. They are also […]
Continue Reading... -
10 things you should know about big data’s secret sauce
TechRepublic posted a great article on how big data adds big value, but can be hard to understand. High-level points are: Big data is a big market Big data is messy Variety equals value Data on its own is worthless Big data is not for everyone, yet Big data still needs human input Big data […]
Continue Reading... -
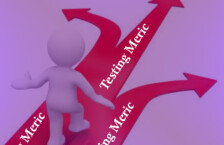
Pick One, Just One
There are so many different test metrics available but not all of them are needed all the time. So today we ask you, if you had to pick only one metric to show testing status, which one would you choose & why? Use the comments section below to tell us which metric you would choose.
Continue Reading... -
Stop Waiting For Metrics
In the past teams had to wait for reports to find out what was going on within their organizations. Are projects on time? Are projects within budget? Organizations use a variety of different tools (defect trackers, test trackers, code trackers, etc.) that are used by various teams to gather information and status on applications/projects . […]
Continue Reading... -
Big Data Word Search
Big data is full of different words, jargon’s, technologies and systems so we put together a word search with some of the words. Hope you enjoy the puzzle. Don’t forget to check out our free online demo to see how TeamQualityPro can help resolve your Big Data needs.
Continue Reading... -
How To Choose The Best Chart For Your Data
There are lots of whitepapers, presentations & blogs out on the Internet that tell you to use one chart type versus another. It’s great that there are so many chart types available but do you know when to use a bar chart versus a line chart? This presentation will provide you information so the next […]
Continue Reading... -
The Good, The Bad, and The Metrics
Last week Mike Lyles & Jay Philips presented the “The Good, The Bad, and The Metrics” at STPCon Spring 2014. Below is the info from the presentation and the corresponding slides: Session Info: Has your organization ever considered replacing a tester that did not write, for example, 15 test cases per day? Is the testing […]
Continue Reading... -

One Bite At A Time
Enterprise business intelligence projects are often very large because there’s data coming from all different sources and each area has their own metrics. You may find yourself stuck getting data or KPI’s from one side of the organization, which holds up the entire project. You want your BI dashboard to show everything but it takes […]
Continue Reading... -

Can You Get A Comprehensive View Of Your Business?
Does your BI dashboard provide you with a comprehensive view of your business? If you don’t have a comprehensive view how do you know if your business is meeting its goals & objectives? Business data is stored in a variety of different systems, 3rd party or partner sources, databases, etc. When data is spread out […]
Continue Reading... -
I Am An Industry Standard Metric So You Must Implement Me
I’m sure there have been tons of times that you’ve heard “It’s an industry standard so we must implement this” or “I was at a conference the other week and they were talking about best practices so we need to implement it this way”. We’ve all heard those sayings multiple times and we just cringe […]
Continue Reading...

Connect With Us
Featured In